Accessible Tourism Market Size, Share & Growth Analysis, 2025-2033
Accessible Tourism Market Size, Share & Growth Analysis, 2025-2033
Segments - by Tourism Type (Domestic, International), by Service Type (Transportation, Accommodation, Travel Agencies, Attractions, Others), by Tourist Type (Elderly, Persons with Disabilities, Families with Children, Others), by Mode Of Booking (Online, Offline), by End-User (Individual, Group, Corporate)



Published : Aug, 2025
| Report ID :CG-148862
| 4.0 Rating
| 95 Reviews
| 296 Pages
| Format :


Accessible Tourism Market: Key Numbers
The Accessible Tourism market was valued at USD 107.4 Billion in 2024 and is projected to reach USD 203.1 Billion by 2033, a CAGR of 7.2%.
| Market size (2024) | USD 107.4 Billion |
|---|---|
| Forecast (2033) | USD 203.1 Billion |
| CAGR (2025-2033) | 7.2% |
| Largest region | Europe |
| Segments covered | Tourism Type, Service Type, Tourist Type, Mode Of Booking, End-User |
| Key companies | Accessible Travel Netherlands, Accessible Journeys, Wheel the World, Sage Traveling, Handiscover |
Accessible Tourism Market Size and Growth Outlook
Our analysis shows that the global accessible tourism market size reached USD 107.4 billion in 2024 and is poised to grow at a robust CAGR of 7.2% from 2025 to 2033. By the end of 2033, the accessible tourism market is forecasted to achieve a value of USD 203.1 billion. This growth is primarily driven by increasing public awareness, legislative support, and the expanding aging population worldwide, which together are fueling the demand for accessible travel solutions and inclusive tourism experiences.
One of the most significant growth drivers in the accessible tourism market is the rising global aging population, particularly in developed regions such as North America and Europe. As the number of elderly travelers increases, so does the demand for tourism services tailored to their specific needs, such as accessible transportation, accommodations, and attractions. Additionally, there has been a notable shift in consumer behavior, with travelers seeking more inclusive and barrier-free experiences. Governments and private sector stakeholders are responding by investing in infrastructure upgrades, adopting universal design principles, and enforcing regulations to ensure accessibility. These efforts not only improve the quality of life for people with disabilities but also open up new revenue streams for tourism businesses.
Technological advancements are another key factor propelling the accessible tourism market forward. Digital platforms and assistive technologies have made it easier for travelers with disabilities or special needs to plan and book their trips. Online booking systems now often include accessibility filters, while mobile applications provide real-time information on accessible routes and facilities. Furthermore, the integration of artificial intelligence and IoT devices in the tourism sector is enhancing the overall travel experience for people with mobility, visual, or hearing impairments. These innovations are not only improving convenience but also fostering greater independence among travelers, thereby expanding the accessible tourism customer base.
Legislative measures and global initiatives are also playing a crucial role in shaping the accessible tourism market. International organizations such as the United Nations World Tourism Organization (UNWTO) and the European Commission have introduced guidelines and action plans to promote accessibility in tourism. Many countries have enacted laws mandating accessible infrastructure in public spaces, transportation, and hospitality venues. These regulatory frameworks are compelling industry players to prioritize accessibility in their development strategies, leading to a more inclusive tourism ecosystem. As a result, destinations that invest in accessible tourism are witnessing increased visitor numbers and enhanced reputations as welcoming places for all travelers.
In this evolving landscape, Deaf-Friendly Tour Services are becoming increasingly important. These services are tailored to meet the needs of travelers who are deaf or hard of hearing, ensuring they have access to the same enriching experiences as other tourists. Tour operators are now offering sign language interpreters, visual guides, and assistive listening devices to enhance the travel experience. This commitment to inclusivity not only broadens the customer base but also enriches the cultural exchange by making destinations more welcoming to all. As the demand for such services grows, businesses that prioritize deaf-friendly options are likely to see increased customer satisfaction and loyalty.
From a regional perspective, Europe leads the accessible tourism market, accounting for the largest share in 2024, followed by North America and Asia Pacific. The high market penetration in Europe can be attributed to strong regulatory support, well-developed infrastructure, and a proactive approach towards inclusivity. North America is also witnessing substantial growth, driven by robust advocacy efforts and technological innovation. Meanwhile, the Asia Pacific region is emerging as a lucrative market, supported by rapid urbanization, rising disposable incomes, and increasing awareness of accessibility issues. Latin America and the Middle East & Africa are gradually catching up, with governments and tourism boards initiating programs to improve accessibility and attract international tourists with special needs.

Accessible Tourism Market by Tourism Type
The accessible tourism market is broadly segmented by tourism type into domestic and international travel, each presenting unique trends and opportunities. Domestic accessible tourism remains the dominant segment, accounting for a significant portion of the market in 2024. This predominance can be attributed to familiarity with local regulations, language, and cultural nuances, which make it easier for travelers with disabilities or special needs to plan and enjoy their trips. Domestic travel also benefits from government incentives and community-based initiatives aimed at promoting inclusivity within national borders. As a result, destinations are investing in accessible public transportation, accommodation, and attractions to cater to local tourists.
International accessible tourism, while smaller in size compared to domestic, is experiencing faster growth, especially in regions with strong cross-border tourism flows such as Europe and North America. The Schengen Area in Europe, for instance, facilitates seamless travel for people with disabilities across multiple countries, thanks to harmonized accessibility standards and mutual recognition of disability documentation. International travelers are increasingly seeking destinations that offer comprehensive accessibility information, reliable medical support, and barrier-free transportation options. This trend is pushing tourism boards and service providers to adopt global best practices and collaborate on international accessibility initiatives.
The rise of specialized tour operators and travel agencies focusing on accessible tourism is further fueling the growth of both domestic and international segments. These agencies offer tailored packages that address the specific needs of elderly travelers, persons with disabilities, and families with children. Services often include accessible transportation, guided tours, and accommodation with adaptive features. By providing end-to-end support, these agencies are reducing the complexity and uncertainty associated with accessible travel, thereby encouraging more individuals to explore new destinations both within and outside their home countries.
Technological advancements are bridging the gap between domestic and international accessible tourism. Online platforms now offer multilingual support, virtual tours, and detailed accessibility information for global destinations. This digital transformation is making it easier for travelers to compare options, read reviews, and make informed decisions regardless of their location. Furthermore, the proliferation of mobile apps and AI-powered travel assistants is enhancing the travel experience for people with disabilities, enabling them to navigate unfamiliar environments with greater confidence.
Accessible Tourism Market Report Scope
| Attributes | Details |
| Report Title | Accessible Tourism Market Research Report 2033 |
| By Tourism Type | Domestic, International |
| By Service Type | Transportation, Accommodation, Travel Agencies, Attractions, Others |
| By Tourist Type | Elderly, Persons with Disabilities, Families with Children, Others |
| By Mode Of Booking | Online, Offline |
| By End-User | Individual, Group, Corporate |
| Regions Covered | North America, Europe, APAC, Latin America, MEA |
| Countries Covered | North America (United States, Canada), Europe (Germany, France, Italy, United Kingdom, Spain, Russia, Rest of Europe), Asia Pacific (China, Japan, South Korea, India, Australia, South East Asia (SEA), Rest of Asia Pacific), Latin America (Mexico, Brazil, Rest of Latin America), Middle East & Africa (Saudi Arabia, South Africa, United Arab Emirates, Rest of Middle East & Africa) |
| Base Year | 2024 |
| Historic Data | 2018-2023 |
| Forecast Period | 2025-2033 |
| Number of Pages | 296 |
| Number of Tables & Figures | 298 |
| Customization Available | Yes, the report can be customized as per your need. |
Accessible Tourism Market by Service Type
Service type is a critical segment in the accessible tourism market, encompassing transportation, accommodation, travel agencies, attractions, and other related services. Accessible transportation forms the backbone of the market, as it enables travelers with disabilities to reach their desired destinations safely and comfortably. In 2024, accessible transportation services, including adapted taxis, wheelchair-accessible buses, and trains with step-free access, accounted for a substantial share of the market. Investments in infrastructure upgrades, such as retrofitting public transport and airports with ramps, lifts, and tactile guidance systems, are further expanding the reach of accessible tourism.
Accommodation services are another vital component, with hotels and resorts increasingly adopting universal design principles to cater to guests with diverse needs. Features such as roll-in showers, grab bars, visual alarms, and accessible entrances are becoming standard in many properties, particularly in developed markets. The hospitality industry is also training staff to better understand and address the requirements of guests with disabilities. As a result, accessible accommodation is not only enhancing guest satisfaction but also driving repeat business and positive word-of-mouth referrals.
Travel agencies specializing in accessible tourism are playing a pivotal role in connecting travelers with suitable services and experiences. These agencies offer personalized itineraries, arrange for accessible transportation and accommodation, and provide on-the-ground support during trips. Their expertise in navigating regulatory requirements and local accessibility standards is invaluable for travelers, especially when visiting unfamiliar destinations. The growing popularity of accessible travel packages is prompting mainstream travel agencies to expand their offerings and partner with accessibility experts.
Moreover, Autism-Friendly Travel is gaining traction as a vital component of the accessible tourism market. This approach focuses on creating environments and experiences that are comfortable and accommodating for individuals on the autism spectrum. Travel agencies and destinations are increasingly offering sensory-friendly attractions, quiet zones, and staff trained in autism awareness. These adaptations help reduce anxiety and sensory overload, making travel more enjoyable for individuals with autism and their families. By embracing autism-friendly practices, the tourism industry is not only enhancing inclusivity but also tapping into a growing market segment that values supportive and understanding travel experiences.
Attractions, including museums, theme parks, and heritage sites, are increasingly prioritizing accessibility to attract a broader audience. Many attractions now offer services such as sign language interpretation, audio guides, tactile exhibits, and wheelchair-friendly pathways. These enhancements not only comply with legal requirements but also reflect a commitment to inclusivity and social responsibility. Other services, such as accessible tour guides, medical assistance, and adaptive sports, are also gaining traction, further enriching the travel experience for people with disabilities and their families.
Accessible Tourism Market by Tourist Type
The accessible tourism market serves a diverse range of tourist types, including the elderly, persons with disabilities, families with children, and others. Elderly travelers represent a significant and growing demographic, driven by increasing life expectancy and higher disposable incomes among retirees. This group often requires accessible transportation, accommodation, and medical support during travel. Tourism providers are responding by offering senior-friendly packages that include features such as step-free access, medical assistance, and flexible itineraries tailored to the pace and preferences of older adults.
Persons with disabilities constitute another core segment of the accessible tourism market. This group encompasses individuals with mobility, visual, hearing, and cognitive impairments, each with unique travel requirements. The market is witnessing a surge in demand for customized services, such as wheelchair-accessible vehicles, sign language interpreters, and sensory-friendly attractions. Advocacy groups and disability organizations are actively collaborating with tourism stakeholders to raise awareness and promote the adoption of inclusive practices.
Families with children, particularly those with young or special needs children, are also driving growth in the accessible tourism market. Parents seek destinations and services that offer safety, convenience, and engaging experiences for all family members. Child-friendly amenities, accessible playgrounds, and family suites with adaptive features are increasingly available in hotels and resorts. Theme parks and attractions are introducing sensory-friendly events and quiet zones to cater to children with autism or sensory processing disorders.
Other tourist types, such as individuals with temporary injuries or chronic health conditions, are also contributing to the expansion of the accessible tourism market. These travelers often require short-term accommodations, such as crutches, ramps, or accessible bathrooms, during their trips. The growing recognition of invisible disabilities is prompting service providers to offer discreet support and flexible options, ensuring that all travelers can enjoy barrier-free experiences regardless of their specific needs.
Accessible Tourism Market by Mode of Booking
The mode of booking is a crucial factor in the accessible tourism market, with online and offline channels catering to different customer preferences. Online booking platforms have gained significant traction in recent years, fueled by the digital transformation of the travel industry. These platforms offer a wealth of information on accessible services, including detailed descriptions, photos, and customer reviews. Accessibility filters and virtual tours enable travelers to assess the suitability of accommodations, transportation, and attractions before making a reservation. The convenience and transparency offered by online booking are particularly valued by tech-savvy travelers and those planning trips independently.
Offline booking channels, such as travel agencies and call centers, continue to play an important role, especially for travelers seeking personalized assistance or complex itineraries. Many individuals with disabilities or special needs prefer to interact directly with travel advisors who can understand their requirements and provide tailored recommendations. Offline channels are also essential for elderly travelers who may be less comfortable with digital technology. Travel agencies specializing in accessible tourism often offer comprehensive support, from pre-trip planning to on-the-ground assistance, ensuring a seamless and stress-free experience.
The integration of omnichannel strategies is becoming increasingly common in the accessible tourism market. Service providers are combining online and offline touchpoints to offer a cohesive customer journey. For example, travelers can research and book services online, then receive personalized support from a dedicated travel advisor. This hybrid approach caters to diverse preferences and enhances customer satisfaction by providing flexibility and choice.
Technological innovations are further transforming the booking process for accessible tourism. AI-powered chatbots, voice assistants, and mobile apps are streamlining the search and reservation process, making it easier for travelers with disabilities to find and book suitable services. These tools can provide real-time information on availability, accessibility features, and local regulations, empowering travelers to make informed decisions and customize their itineraries according to their needs.
Accessible Tourism Market by End-User
The accessible tourism market is segmented by end-user into individual, group, and corporate travelers, each with distinct requirements and preferences. Individual travelers, including solo adventurers and couples, represent a significant share of the market. These travelers often seek flexibility, independence, and personalized experiences. Service providers are responding by offering customizable itineraries, accessible accommodation options, and self-guided tours. The proliferation of digital tools and mobile apps is empowering individual travelers with disabilities to plan and navigate their trips with greater confidence and autonomy.
Group travel, including tours organized for elderly associations, disability organizations, and families, is another important segment. Group travel offers the advantage of shared support and companionship, making it an attractive option for people with similar needs or interests. Tour operators specializing in accessible tourism design group packages that include accessible transportation, group discounts, and dedicated guides. These packages often cater to specific themes, such as cultural tours, adventure trips, or wellness retreats, ensuring that all participants can enjoy inclusive and enriching experiences.
Corporate travel is an emerging segment in the accessible tourism market, driven by the increasing emphasis on diversity, equity, and inclusion in the workplace. Companies are recognizing the importance of providing accessible travel options for employees with disabilities or special needs, whether for business trips, conferences, or team-building events. Corporate travel management companies are partnering with accessibility experts to develop inclusive travel policies and ensure compliance with legal requirements. This trend is expected to gain momentum as organizations strive to create more inclusive and supportive work environments.
The growing recognition of intersectionality within the accessible tourism market is prompting service providers to adopt a more holistic approach. Many travelers belong to multiple segments, such as elderly individuals with disabilities or families traveling with both young children and elderly relatives. By offering flexible and comprehensive solutions, tourism providers can cater to the diverse and evolving needs of their customers, driving loyalty and repeat business in the long term.
Accessible Tourism Market Opportunities and Threats
The accessible tourism market presents significant opportunities for growth and innovation, driven by demographic trends, technological advancements, and evolving consumer expectations. One of the most promising opportunities lies in the development of smart cities and destinations that prioritize accessibility and inclusivity. By leveraging digital technologies, such as IoT devices, AI-powered navigation tools, and real-time accessibility information, cities can enhance the travel experience for people with disabilities and attract a broader range of visitors. Furthermore, the adoption of universal design principles in infrastructure development can create environments that are welcoming and accessible to all, regardless of age or ability.
Another major opportunity is the expansion of accessible tourism offerings in emerging markets, particularly in Asia Pacific, Latin America, and the Middle East & Africa. As these regions experience rapid urbanization and economic growth, there is a growing demand for inclusive travel experiences among both domestic and international tourists. Governments and tourism boards can capitalize on this trend by investing in accessible infrastructure, launching awareness campaigns, and partnering with disability organizations to develop tailored tourism products. By positioning themselves as accessible destinations, these regions can tap into a lucrative and underserved market segment.
Despite the positive outlook, the accessible tourism market faces several restraining factors that could hinder its growth. One of the primary challenges is the lack of standardized accessibility regulations and enforcement across countries and regions. Inconsistent standards can create confusion and uncertainty for travelers, making it difficult to plan and enjoy barrier-free experiences. Additionally, the high cost of retrofitting existing infrastructure and training staff can be a deterrent for small and medium-sized tourism businesses. Addressing these challenges will require coordinated efforts from governments, industry stakeholders, and advocacy groups to harmonize standards, provide financial incentives, and promote best practices in accessibility.
Accessible Tourism Market Size by Region
Europe continues to lead the global accessible tourism market, accounting for the largest regional share with a market size of USD 39.2 billion in 2024. The region's strong performance is underpinned by comprehensive legislative frameworks, such as the European Accessibility Act, and a well-developed tourism infrastructure that prioritizes inclusivity. European destinations are renowned for their accessible public transportation systems, barrier-free attractions, and widespread adoption of universal design principles. The region's proactive approach to accessibility has not only enhanced the quality of life for residents but also attracted a growing number of international tourists with disabilities or special needs.
North America is the second-largest market for accessible tourism, with a market size of USD 28.6 billion in 2024 and a projected CAGR of 7.5% through 2033. The United States and Canada are at the forefront of accessible tourism innovation, driven by strong advocacy efforts, robust legal protections, and significant investments in technology. Major cities such as New York, Los Angeles, and Toronto have implemented comprehensive accessibility programs, while national parks and heritage sites are increasingly offering adaptive services and facilities. The region's commitment to diversity, equity, and inclusion is further bolstering the growth of the accessible tourism market.
The Asia Pacific region is emerging as a high-growth market, with a market size of USD 22.1 billion in 2024 and substantial untapped potential. Rapid urbanization, rising disposable incomes, and increasing awareness of accessibility issues are driving demand for inclusive travel experiences. Countries such as Japan, Australia, and Singapore are leading the way with innovative accessibility initiatives and infrastructure upgrades. Meanwhile, Latin America and the Middle East & Africa are gradually catching up, supported by government-led programs and partnerships with international organizations. While these regions currently account for smaller shares of the global market, their growth prospects are strong as accessibility becomes a higher priority in national tourism strategies.

Accessible Tourism Market Competitive Landscape
The accessible tourism market is characterized by a dynamic and competitive landscape, with a diverse array of players ranging from multinational hotel chains and transportation providers to specialized travel agencies and technology startups. Leading companies are investing heavily in accessible infrastructure, staff training, and digital innovation to differentiate themselves and capture a larger share of the market. Strategic partnerships and collaborations with disability organizations, advocacy groups, and government agencies are also common, as industry players seek to align their offerings with evolving accessibility standards and best practices.
Innovation is a key driver of competitiveness in the accessible tourism market. Companies are leveraging advanced technologies, such as AI-powered travel assistants, virtual reality tours, and IoT-enabled navigation tools, to enhance the travel experience for people with disabilities. These innovations not only improve convenience and safety but also foster greater independence among travelers. Furthermore, the integration of accessibility features into mainstream travel platforms is making it easier for all customers to find and book suitable services, driving broader market adoption and growth.
Customer-centricity is at the heart of successful strategies in the accessible tourism market. Leading companies are prioritizing personalized service, transparent communication, and continuous feedback to better understand and address the needs of diverse travelers. This approach is reflected in the growing popularity of tailored travel packages, adaptive sports programs, and sensory-friendly attractions. By fostering a culture of inclusivity and empathy, industry players are building strong brand reputations and securing long-term customer loyalty.
Some of the major companies operating in the accessible tourism market include AccorHotels, Marriott International, Hilton Worldwide, Expedia Group, Accessible Travel Netherlands, Sage Traveling, and Wheel the World. AccorHotels and Marriott International have set industry benchmarks by incorporating accessible design features across their global portfolios and offering specialized training for staff. Hilton Worldwide is renowned for its commitment to inclusivity, with accessible rooms, adaptive equipment, and digital accessibility tools available at many properties. Expedia Group has integrated accessibility filters and information into its booking platforms, making it easier for travelers to find suitable options.
Niche players such as Accessible Travel Netherlands, Sage Traveling, and Wheel the World specialize in providing tailored travel solutions for people with disabilities. These companies offer end-to-end support, from trip planning and booking to on-the-ground assistance and accessible guided tours. Their expertise in navigating regulatory requirements and local accessibility standards is highly valued by travelers seeking barrier-free experiences. By focusing on customer needs and leveraging innovative technologies, these companies are setting new standards for inclusivity in the tourism industry and driving the growth of the accessible tourism market worldwide.
Top Companies in the Accessible Tourism Market
- Accessible Travel Netherlands
- Accessible Journeys
- Wheel the World
- Sage Traveling
- Handiscover
- Travel for All
- Special Needs Group, Inc.
- Accessible Italy
- Enable Holidays
- Mobility Mojo
- Accessible Portugal
- Accessible Travel Online
- Disabled Holidays
- Flying Wheels Travel
- Accessible Madrid
- Travegali.com
- Accessible Japan
- Limitless Travel
- Planet Abled
- Accessible Vietnam Travel

Segments
The Accessible Tourism market has been segmented on the basis of
Tourism Type
- Domestic
- International
Service Type
- Transportation
- Accommodation
- Travel Agencies
- Attractions
- Others
Tourist Type
- Elderly
- Persons with Disabilities
- Families with Children
- Others
Mode Of Booking
- Online
- Offline
End-User
- Individual
- Group
- Corporate
Frequently Asked Questions
Opportunities include developing smart, accessible cities, expanding offerings in emerging markets, leveraging digital technologies, and adopting universal design principles in tourism infrastructure.
Major players include AccorHotels, Marriott International, Hilton Worldwide, Expedia Group, Accessible Travel Netherlands, Sage Traveling, and Wheel the World.
Challenges include inconsistent accessibility regulations across regions, high costs of retrofitting infrastructure, and the need for staff training and standardization.
Travelers can book accessible tourism services online via digital platforms or offline through specialized travel agencies and call centers. Omnichannel strategies combining both are increasingly popular.
Technological advancements like AI, IoT, online booking platforms with accessibility filters, mobile apps, and virtual tours are making travel planning easier and more inclusive for people with disabilities.
The main target groups are elderly travelers, persons with disabilities (mobility, visual, hearing, cognitive), families with children (including special needs), and individuals with temporary injuries or chronic health conditions.
Accessible tourism services include transportation (adapted taxis, accessible buses and trains), accommodation (hotels with universal design), travel agencies specializing in accessible travel, and accessible attractions such as museums and theme parks.
Europe leads the accessible tourism market, followed by North America and Asia Pacific. Europe’s dominance is due to strong regulations, well-developed infrastructure, and a proactive approach to inclusivity.
Key growth drivers include the increasing aging population, rising public awareness, legislative support, technological advancements, and investments in accessible infrastructure.
The global accessible tourism market reached USD 107.4 billion in 2024 and is expected to grow at a CAGR of 7.2% from 2025 to 2033, reaching USD 203.1 billion by 2033.
Table Of Content
Chapter 1 Executive SummaryChapter 2 Assumptions and Acronyms Used
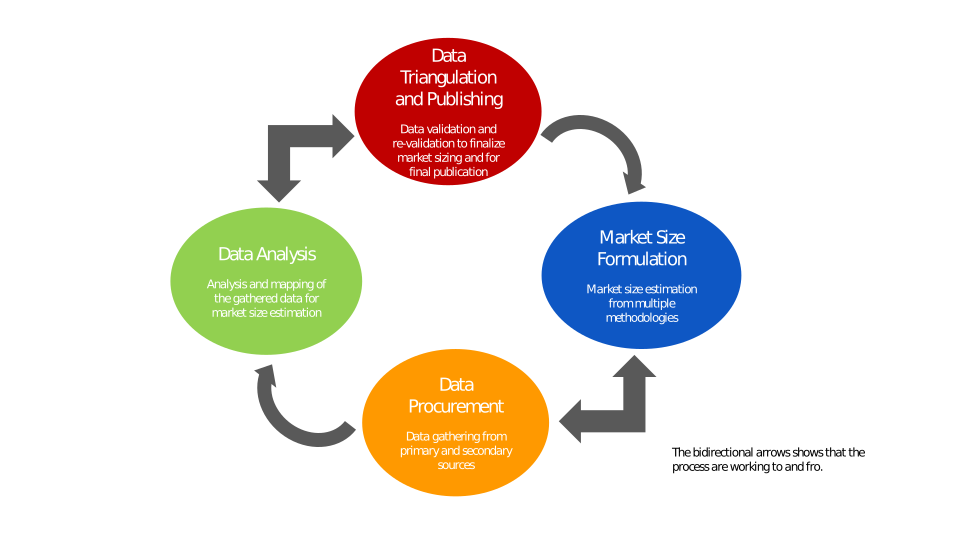
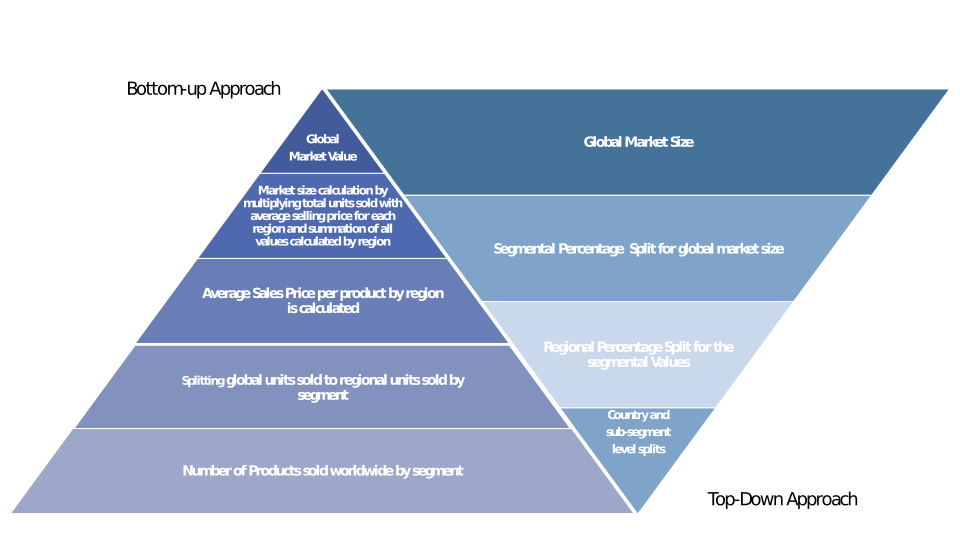
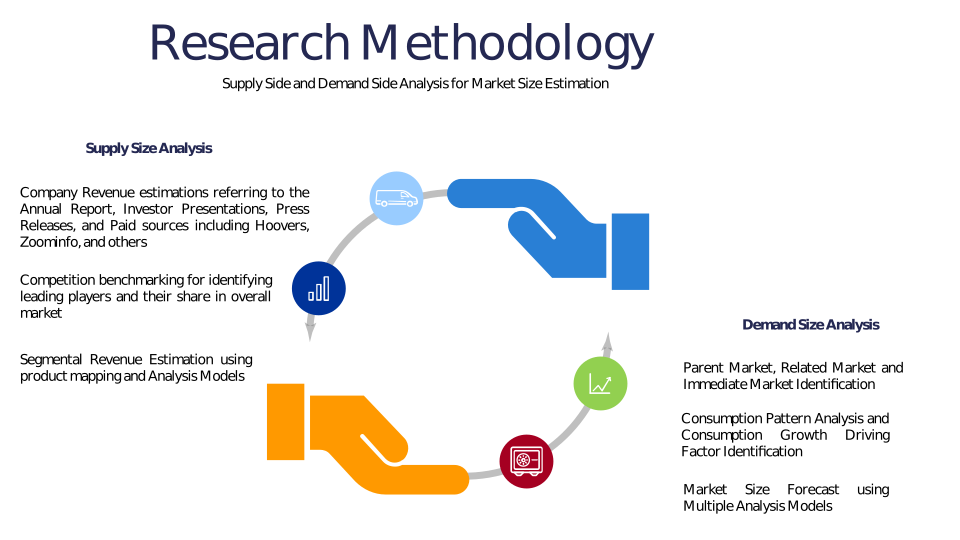
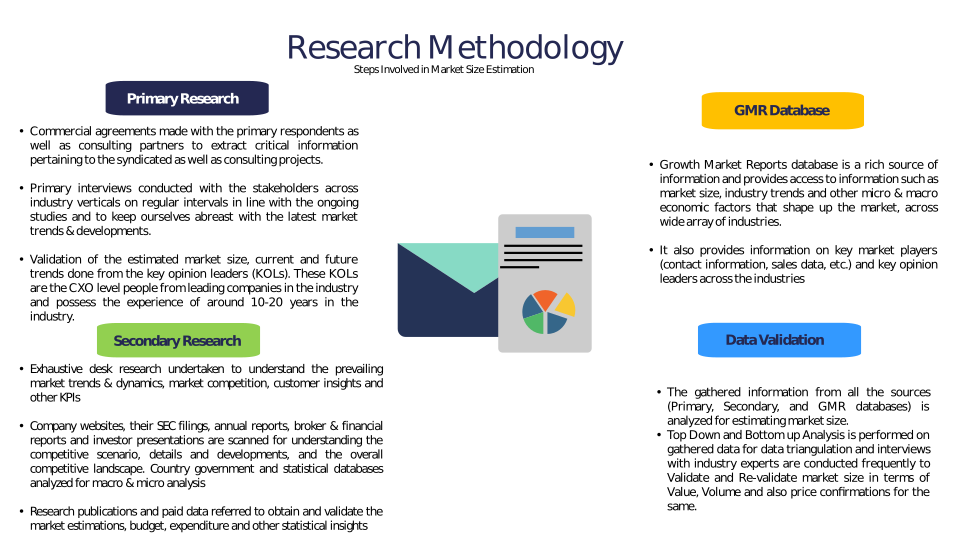
Chapter 3 Research Methodology
Chapter 4 Accessible Tourism Market Overview
4.1 Introduction
4.1.1 Market Taxonomy
4.1.2 Market Definition
4.1.3 Macro-Economic Factors Impacting the Market Growth
4.2 Accessible Tourism Market Dynamics
4.2.1 Market Drivers
4.2.2 Market Restraints
4.2.3 Market Opportunity
4.3 Accessible Tourism Market - Supply Chain Analysis
4.3.1 List of Key Suppliers
4.3.2 List of Key Distributors
4.3.3 List of Key Consumers
4.4 Key Forces Shaping the Accessible Tourism Market
4.4.1 Bargaining Power of Suppliers
4.4.2 Bargaining Power of Buyers
4.4.3 Threat of Substitution
4.4.4 Threat of New Entrants
4.4.5 Competitive Rivalry
4.5 Global Accessible Tourism Market Size & Forecast, 2023-2032
4.5.1 Accessible Tourism Market Size and Y-o-Y Growth
4.5.2 Accessible Tourism Market Absolute $ Opportunity
Chapter 5 Global Accessible Tourism Market Analysis and Forecast By Tourism Type
5.1 Introduction
5.1.1 Key Market Trends & Growth Opportunities By Tourism Type
5.1.2 Basis Point Share (BPS) Analysis By Tourism Type
5.1.3 Absolute $ Opportunity Assessment By Tourism Type
5.2 Accessible Tourism Market Size Forecast By Tourism Type
5.2.1 Domestic
5.2.2 International
5.3 Market Attractiveness Analysis By Tourism Type
Chapter 6 Global Accessible Tourism Market Analysis and Forecast By Service Type
6.1 Introduction
6.1.1 Key Market Trends & Growth Opportunities By Service Type
6.1.2 Basis Point Share (BPS) Analysis By Service Type
6.1.3 Absolute $ Opportunity Assessment By Service Type
6.2 Accessible Tourism Market Size Forecast By Service Type
6.2.1 Transportation
6.2.2 Accommodation
6.2.3 Travel Agencies
6.2.4 Attractions
6.2.5 Others
6.3 Market Attractiveness Analysis By Service Type
Chapter 7 Global Accessible Tourism Market Analysis and Forecast By Tourist Type
7.1 Introduction
7.1.1 Key Market Trends & Growth Opportunities By Tourist Type
7.1.2 Basis Point Share (BPS) Analysis By Tourist Type
7.1.3 Absolute $ Opportunity Assessment By Tourist Type
7.2 Accessible Tourism Market Size Forecast By Tourist Type
7.2.1 Elderly
7.2.2 Persons with Disabilities
7.2.3 Families with Children
7.2.4 Others
7.3 Market Attractiveness Analysis By Tourist Type
Chapter 8 Global Accessible Tourism Market Analysis and Forecast By Mode Of Booking
8.1 Introduction
8.1.1 Key Market Trends & Growth Opportunities By Mode Of Booking
8.1.2 Basis Point Share (BPS) Analysis By Mode Of Booking
8.1.3 Absolute $ Opportunity Assessment By Mode Of Booking
8.2 Accessible Tourism Market Size Forecast By Mode Of Booking
8.2.1 Online
8.2.2 Offline
8.3 Market Attractiveness Analysis By Mode Of Booking
Chapter 9 Global Accessible Tourism Market Analysis and Forecast By End-User
9.1 Introduction
9.1.1 Key Market Trends & Growth Opportunities By End-User
9.1.2 Basis Point Share (BPS) Analysis By End-User
9.1.3 Absolute $ Opportunity Assessment By End-User
9.2 Accessible Tourism Market Size Forecast By End-User
9.2.1 Individual
9.2.2 Group
9.2.3 Corporate
9.3 Market Attractiveness Analysis By End-User
Chapter 10 Global Accessible Tourism Market Analysis and Forecast by Region
10.1 Introduction
10.1.1 Key Market Trends & Growth Opportunities By Region
10.1.2 Basis Point Share (BPS) Analysis By Region
10.1.3 Absolute $ Opportunity Assessment By Region
10.2 Accessible Tourism Market Size Forecast By Region
10.2.1 North America
10.2.2 Europe
10.2.3 Asia Pacific
10.2.4 Latin America
10.2.5 Middle East & Africa (MEA)
10.3 Market Attractiveness Analysis By Region
Chapter 11 Coronavirus Disease (COVID-19) Impact
11.1 Introduction
11.2 Current & Future Impact Analysis
11.3 Economic Impact Analysis
11.4 Government Policies
11.5 Investment Scenario
Chapter 12 North America Accessible Tourism Analysis and Forecast
12.1 Introduction
12.2 North America Accessible Tourism Market Size Forecast by Country
12.2.1 U.S.
12.2.2 Canada
12.3 Basis Point Share (BPS) Analysis by Country
12.4 Absolute $ Opportunity Assessment by Country
12.5 Market Attractiveness Analysis by Country
12.6 North America Accessible Tourism Market Size Forecast By Tourism Type
12.6.1 Domestic
12.6.2 International
12.7 Basis Point Share (BPS) Analysis By Tourism Type
12.8 Absolute $ Opportunity Assessment By Tourism Type
12.9 Market Attractiveness Analysis By Tourism Type
12.10 North America Accessible Tourism Market Size Forecast By Service Type
12.10.1 Transportation
12.10.2 Accommodation
12.10.3 Travel Agencies
12.10.4 Attractions
12.10.5 Others
12.11 Basis Point Share (BPS) Analysis By Service Type
12.12 Absolute $ Opportunity Assessment By Service Type
12.13 Market Attractiveness Analysis By Service Type
12.14 North America Accessible Tourism Market Size Forecast By Tourist Type
12.14.1 Elderly
12.14.2 Persons with Disabilities
12.14.3 Families with Children
12.14.4 Others
12.15 Basis Point Share (BPS) Analysis By Tourist Type
12.16 Absolute $ Opportunity Assessment By Tourist Type
12.17 Market Attractiveness Analysis By Tourist Type
12.18 North America Accessible Tourism Market Size Forecast By Mode Of Booking
12.18.1 Online
12.18.2 Offline
12.19 Basis Point Share (BPS) Analysis By Mode Of Booking
12.20 Absolute $ Opportunity Assessment By Mode Of Booking
12.21 Market Attractiveness Analysis By Mode Of Booking
12.22 North America Accessible Tourism Market Size Forecast By End-User
12.22.1 Individual
12.22.2 Group
12.22.3 Corporate
12.23 Basis Point Share (BPS) Analysis By End-User
12.24 Absolute $ Opportunity Assessment By End-User
12.25 Market Attractiveness Analysis By End-User
Chapter 13 Europe Accessible Tourism Analysis and Forecast
13.1 Introduction
13.2 Europe Accessible Tourism Market Size Forecast by Country
13.2.1 Germany
13.2.2 France
13.2.3 Italy
13.2.4 U.K.
13.2.5 Spain
13.2.6 Russia
13.2.7 Rest of Europe
13.3 Basis Point Share (BPS) Analysis by Country
13.4 Absolute $ Opportunity Assessment by Country
13.5 Market Attractiveness Analysis by Country
13.6 Europe Accessible Tourism Market Size Forecast By Tourism Type
13.6.1 Domestic
13.6.2 International
13.7 Basis Point Share (BPS) Analysis By Tourism Type
13.8 Absolute $ Opportunity Assessment By Tourism Type
13.9 Market Attractiveness Analysis By Tourism Type
13.10 Europe Accessible Tourism Market Size Forecast By Service Type
13.10.1 Transportation
13.10.2 Accommodation
13.10.3 Travel Agencies
13.10.4 Attractions
13.10.5 Others
13.11 Basis Point Share (BPS) Analysis By Service Type
13.12 Absolute $ Opportunity Assessment By Service Type
13.13 Market Attractiveness Analysis By Service Type
13.14 Europe Accessible Tourism Market Size Forecast By Tourist Type
13.14.1 Elderly
13.14.2 Persons with Disabilities
13.14.3 Families with Children
13.14.4 Others
13.15 Basis Point Share (BPS) Analysis By Tourist Type
13.16 Absolute $ Opportunity Assessment By Tourist Type
13.17 Market Attractiveness Analysis By Tourist Type
13.18 Europe Accessible Tourism Market Size Forecast By Mode Of Booking
13.18.1 Online
13.18.2 Offline
13.19 Basis Point Share (BPS) Analysis By Mode Of Booking
13.20 Absolute $ Opportunity Assessment By Mode Of Booking
13.21 Market Attractiveness Analysis By Mode Of Booking
13.22 Europe Accessible Tourism Market Size Forecast By End-User
13.22.1 Individual
13.22.2 Group
13.22.3 Corporate
13.23 Basis Point Share (BPS) Analysis By End-User
13.24 Absolute $ Opportunity Assessment By End-User
13.25 Market Attractiveness Analysis By End-User
Chapter 14 Asia Pacific Accessible Tourism Analysis and Forecast
14.1 Introduction
14.2 Asia Pacific Accessible Tourism Market Size Forecast by Country
14.2.1 China
14.2.2 Japan
14.2.3 South Korea
14.2.4 India
14.2.5 Australia
14.2.6 South East Asia (SEA)
14.2.7 Rest of Asia Pacific (APAC)
14.3 Basis Point Share (BPS) Analysis by Country
14.4 Absolute $ Opportunity Assessment by Country
14.5 Market Attractiveness Analysis by Country
14.6 Asia Pacific Accessible Tourism Market Size Forecast By Tourism Type
14.6.1 Domestic
14.6.2 International
14.7 Basis Point Share (BPS) Analysis By Tourism Type
14.8 Absolute $ Opportunity Assessment By Tourism Type
14.9 Market Attractiveness Analysis By Tourism Type
14.10 Asia Pacific Accessible Tourism Market Size Forecast By Service Type
14.10.1 Transportation
14.10.2 Accommodation
14.10.3 Travel Agencies
14.10.4 Attractions
14.10.5 Others
14.11 Basis Point Share (BPS) Analysis By Service Type
14.12 Absolute $ Opportunity Assessment By Service Type
14.13 Market Attractiveness Analysis By Service Type
14.14 Asia Pacific Accessible Tourism Market Size Forecast By Tourist Type
14.14.1 Elderly
14.14.2 Persons with Disabilities
14.14.3 Families with Children
14.14.4 Others
14.15 Basis Point Share (BPS) Analysis By Tourist Type
14.16 Absolute $ Opportunity Assessment By Tourist Type
14.17 Market Attractiveness Analysis By Tourist Type
14.18 Asia Pacific Accessible Tourism Market Size Forecast By Mode Of Booking
14.18.1 Online
14.18.2 Offline
14.19 Basis Point Share (BPS) Analysis By Mode Of Booking
14.20 Absolute $ Opportunity Assessment By Mode Of Booking
14.21 Market Attractiveness Analysis By Mode Of Booking
14.22 Asia Pacific Accessible Tourism Market Size Forecast By End-User
14.22.1 Individual
14.22.2 Group
14.22.3 Corporate
14.23 Basis Point Share (BPS) Analysis By End-User
14.24 Absolute $ Opportunity Assessment By End-User
14.25 Market Attractiveness Analysis By End-User
Chapter 15 Latin America Accessible Tourism Analysis and Forecast
15.1 Introduction
15.2 Latin America Accessible Tourism Market Size Forecast by Country
15.2.1 Brazil
15.2.2 Mexico
15.2.3 Rest of Latin America (LATAM)
15.3 Basis Point Share (BPS) Analysis by Country
15.4 Absolute $ Opportunity Assessment by Country
15.5 Market Attractiveness Analysis by Country
15.6 Latin America Accessible Tourism Market Size Forecast By Tourism Type
15.6.1 Domestic
15.6.2 International
15.7 Basis Point Share (BPS) Analysis By Tourism Type
15.8 Absolute $ Opportunity Assessment By Tourism Type
15.9 Market Attractiveness Analysis By Tourism Type
15.10 Latin America Accessible Tourism Market Size Forecast By Service Type
15.10.1 Transportation
15.10.2 Accommodation
15.10.3 Travel Agencies
15.10.4 Attractions
15.10.5 Others
15.11 Basis Point Share (BPS) Analysis By Service Type
15.12 Absolute $ Opportunity Assessment By Service Type
15.13 Market Attractiveness Analysis By Service Type
15.14 Latin America Accessible Tourism Market Size Forecast By Tourist Type
15.14.1 Elderly
15.14.2 Persons with Disabilities
15.14.3 Families with Children
15.14.4 Others
15.15 Basis Point Share (BPS) Analysis By Tourist Type
15.16 Absolute $ Opportunity Assessment By Tourist Type
15.17 Market Attractiveness Analysis By Tourist Type
15.18 Latin America Accessible Tourism Market Size Forecast By Mode Of Booking
15.18.1 Online
15.18.2 Offline
15.19 Basis Point Share (BPS) Analysis By Mode Of Booking
15.20 Absolute $ Opportunity Assessment By Mode Of Booking
15.21 Market Attractiveness Analysis By Mode Of Booking
15.22 Latin America Accessible Tourism Market Size Forecast By End-User
15.22.1 Individual
15.22.2 Group
15.22.3 Corporate
15.23 Basis Point Share (BPS) Analysis By End-User
15.24 Absolute $ Opportunity Assessment By End-User
15.25 Market Attractiveness Analysis By End-User
Chapter 16 Middle East & Africa (MEA) Accessible Tourism Analysis and Forecast
16.1 Introduction
16.2 Middle East & Africa (MEA) Accessible Tourism Market Size Forecast by Country
16.2.1 Saudi Arabia
16.2.2 South Africa
16.2.3 UAE
16.2.4 Rest of Middle East & Africa (MEA)
16.3 Basis Point Share (BPS) Analysis by Country
16.4 Absolute $ Opportunity Assessment by Country
16.5 Market Attractiveness Analysis by Country
16.6 Middle East & Africa (MEA) Accessible Tourism Market Size Forecast By Tourism Type
16.6.1 Domestic
16.6.2 International
16.7 Basis Point Share (BPS) Analysis By Tourism Type
16.8 Absolute $ Opportunity Assessment By Tourism Type
16.9 Market Attractiveness Analysis By Tourism Type
16.10 Middle East & Africa (MEA) Accessible Tourism Market Size Forecast By Service Type
16.10.1 Transportation
16.10.2 Accommodation
16.10.3 Travel Agencies
16.10.4 Attractions
16.10.5 Others
16.11 Basis Point Share (BPS) Analysis By Service Type
16.12 Absolute $ Opportunity Assessment By Service Type
16.13 Market Attractiveness Analysis By Service Type
16.14 Middle East & Africa (MEA) Accessible Tourism Market Size Forecast By Tourist Type
16.14.1 Elderly
16.14.2 Persons with Disabilities
16.14.3 Families with Children
16.14.4 Others
16.15 Basis Point Share (BPS) Analysis By Tourist Type
16.16 Absolute $ Opportunity Assessment By Tourist Type
16.17 Market Attractiveness Analysis By Tourist Type
16.18 Middle East & Africa (MEA) Accessible Tourism Market Size Forecast By Mode Of Booking
16.18.1 Online
16.18.2 Offline
16.19 Basis Point Share (BPS) Analysis By Mode Of Booking
16.20 Absolute $ Opportunity Assessment By Mode Of Booking
16.21 Market Attractiveness Analysis By Mode Of Booking
16.22 Middle East & Africa (MEA) Accessible Tourism Market Size Forecast By End-User
16.22.1 Individual
16.22.2 Group
16.22.3 Corporate
16.23 Basis Point Share (BPS) Analysis By End-User
16.24 Absolute $ Opportunity Assessment By End-User
16.25 Market Attractiveness Analysis By End-User
Chapter 17 Competition Landscape
17.1 Accessible Tourism Market: Competitive Dashboard
17.2 Global Accessible Tourism Market: Market Share Analysis, 2023
17.3 Company Profiles (Details – Overview, Financials, Developments, Strategy)
17.3.1 Accessible Travel Netherlands
17.3.2 Accessible Journeys
17.3.3 Wheel the World
17.3.4 Sage Traveling
17.3.5 Handiscover
17.3.6 Travel for All
17.3.7 Special Needs Group, Inc.
17.3.8 Accessible Italy
17.3.9 Enable Holidays
17.3.10 Mobility Mojo
17.3.11 Accessible Portugal
17.3.12 Accessible Travel Online
17.3.13 Disabled Holidays
17.3.14 Flying Wheels Travel
17.3.15 Accessible Madrid
17.3.16 Travegali.com
17.3.17 Accessible Japan
17.3.18 Limitless Travel
17.3.19 Planet Abled
17.3.20 Accessible Vietnam Travel
Methodology
Related Reports
Some other reports from this category!





Our Clients